ABC Sales Performance Analysis
Objective
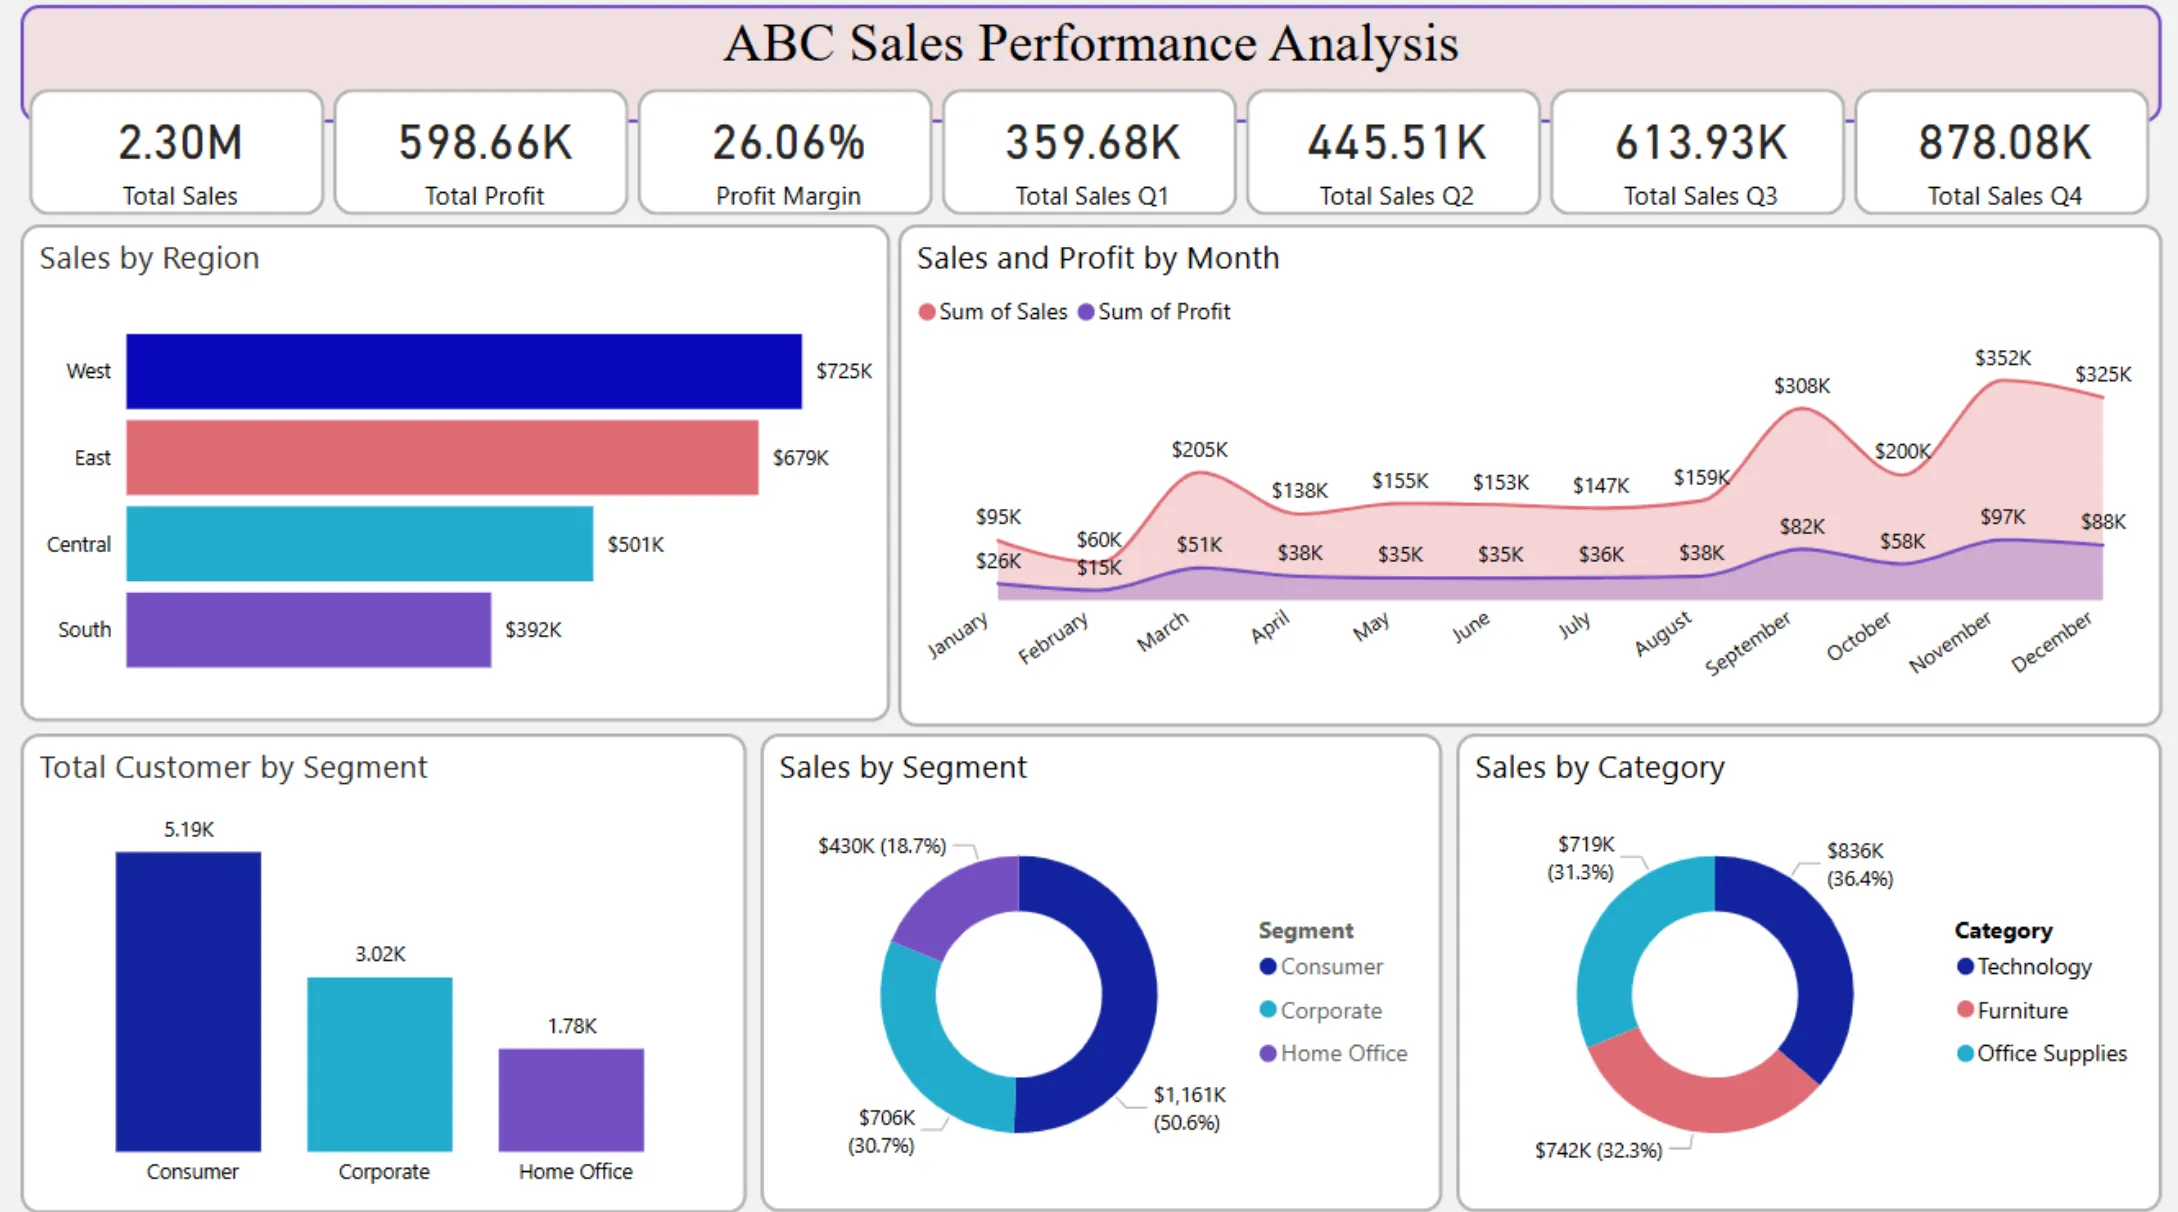
The primary objective of this analysis is to evaluate the sales performance of a new online company (ABC) specializing in technology, furniture, and office supplies over its inaugural year. By examining sales data segmented by region, month, quarter, segment, and category, the aim is to identify key trends, top-performing products, and areas for improvement to inform strategic decision-making.
Key Features of the Data
The dataset encompasses the following dimensions:
- Region: Geographical areas where products are sold.
- Month and Quarter: Timeframes of sales transactions.
- Segment: Customer classifications, such as consumers, home offices, and corporate clients.
- Category: Product divisions, including technology, furniture, and office supplies.
Analysis
Sales Performance by Category
- Technology: Analyzed revenue and units sold to determine its contribution to total sales.
- Furniture: Assessed sales figures to understand its market share.
- Office Supplies: Evaluated performance metrics to gauge demand.
Regional Sales Distribution
Compared sales across different regions to identify high-performing areas and regions with growth potential.
Temporal Sales Trends
Identified peak sales periods (monthly & quarterly) and seasonal fluctuations to inform inventory and marketing strategies.
Customer Segment Analysis
Evaluated purchasing patterns across customer segments to tailor marketing efforts and product offerings.
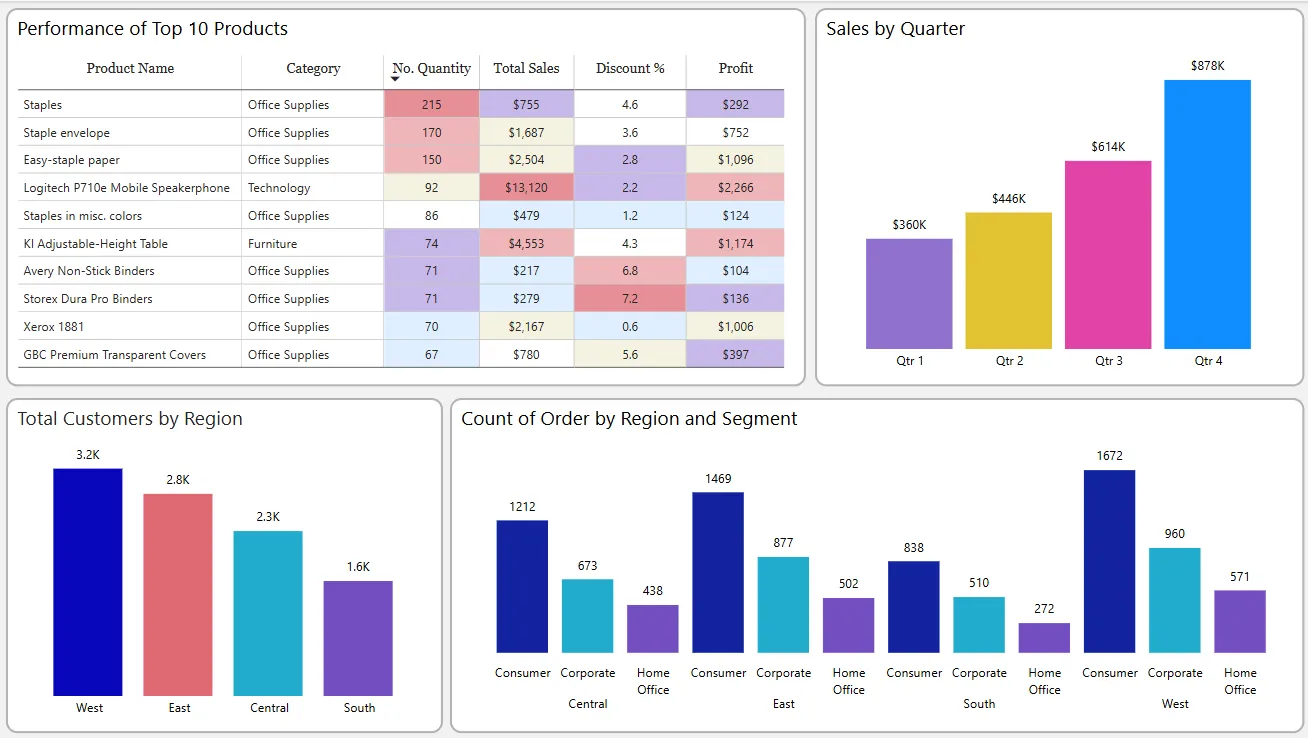
Top N Best-Selling Products
Identified top-performing products in each category based on sales volume and revenue.
Key Insights
- Dominant Product Category: Determined which category—technology, furniture, or office supplies—drives the most revenue.
- Regional Leaders: Identified regions with the highest sales and potential factors contributing to their success.
- Seasonal Peaks: Recognized specific months or quarters with increased sales, possibly due to seasonal demand or promotional activities.
- Customer Preferences: Understood which segments are most profitable and their preferred product categories.
- Top Products: Highlighted the best-selling products, providing insights into customer preferences and inventory management.
Impact
This analysis offers actionable insights that can significantly impact ABC business strategies:
- Inventory Optimization: Aligned stock levels with demand patterns to reduce holding costs and prevent stockouts.
- Targeted Marketing: Developed focused marketing campaigns based on regional performance and customer segment preferences.
- Product Development: Invested in expanding or enhancing top-performing product lines to meet customer demand.
- Resource Allocation: Allocated resources effectively to regions and segments with the highest growth potential.
Conclusion
The comprehensive analysis of ABC Company’s first-year sales data reveals critical insights into product performance, regional dynamics, and customer behavior. By leveraging these findings, ABC can make informed decisions to drive growth, enhance customer satisfaction, and establish a competitive edge in the market.
Top 10 Best-Selling Products
Identifying the top 10 best-selling products is crucial for understanding customer preferences and optimizing inventory. ABC can pinpoint which products resonate most with customers by analyzing sales volume and revenue. This information aids in strategic planning, ensuring that high-demand items are readily available, and can also inform marketing and promotional efforts to further boost sales of these popular products.